In a previous article, we've described the importance of the install vs. the downloads. We've also outlined how to make anonymous users into registered users. This is just the beginning of understanding the complex behavior of your audience. In the end, your goal is, of course, to keep users longer, and to let them make more frequent purchases, with a higher monetary value. To do this, your customers deserve an engaging experience. The means and tools to realize these experiences are available in our platform. But it is just as important to tune them to the ever-changing behavior of your customers. For this, you need to have insight into the growth of your audience, how long they stay as a customer, and how intensively they use every available channel.
Devices and users
There are several graphs available that give you a good insight into the growth of your userbase. In Notificare, you start by assigning devices to a user profile. A device can be an SMS number, an email address, an native mobile user or a web push subscriber. The more channels you set up and assign to the user profile, the more relevant you can become, allowing you to determine which marketing channel works better for each user.
Our platform clearly shows what the growth of your active users looks like. If a user ultimately opts-out in all their registered devices, he or she disappears from the platform and becomes inactive. Users will remain active if it is possible to reach them on one or more devices.
It may happen, for example when an app is uninstalled, an email address is no longer reachable or a phone number is deactivated, that the user does not immediately become inactive. This is because only after you send a message to those devices we will be able to receive this feedback. Therefore, when sending a message to a large group of devices, you often see a decrease in the number of users. Don't worry, this is not due to the content of the message; these users were not there anyway. Only when you provide a way for users to opt-out from your push, email or SMS messages, our platform will remove those devices in real-time.
Let's dive a bit further in these devices and user insights. An important goal is to make your users identifiable so that you don't have to spray and pray when reaching out to your customers. If your applications use any form of authentication, you will want to create a richer user profile, by assigning a user identifier and a name to those devices. On the other hand, if your apps do not offer a sign up feature, you can still resort to device or user categorization to avoid having an entire userbase with only anonymous users. Within the platform, we keep track of different KPIs to make sure your strategy will deliver.
Users
This graph shows the number of users registered by your application. The metric is collected whenever users are registered in your mobile or web application, via our REST API or, in case of email and SMS, when created via our dashboard. It also shows the ratio of users that are registered with an identifier in relation to the total amount of active users. Active Users can also include Anonymous Users. If you are assigning devices to a user identifier, and this rate is low, you either have a problem with your sign up process, or they log out regularly. Try to keep the ratio at about 80-90%, and you are doing a great job.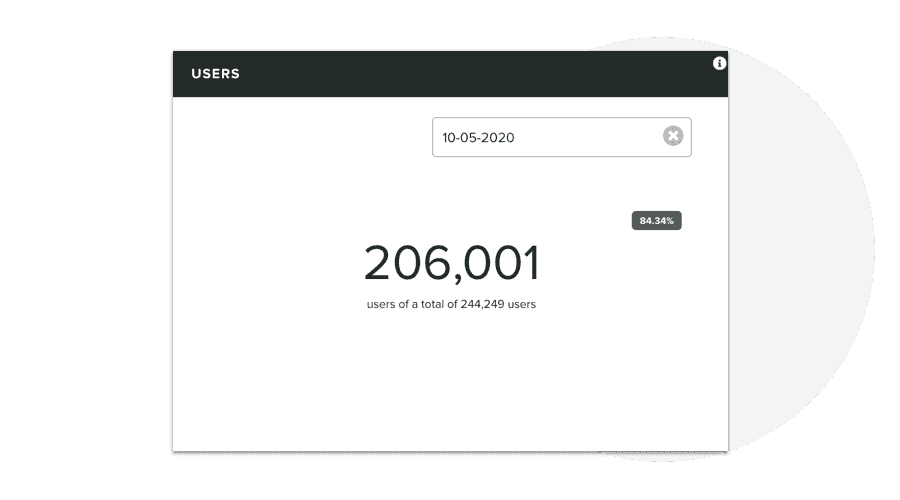
User Registered Devices
This graph gives you the total number of devices assigned to a user identifier. The metric is collected whenever a mobile or web push token, email address or SMS number is assigned to a specific user profile. As mentioned before, a user can have multiple devices. Comparing this number with the users should give you a good insight into how many devices, on average, a user has.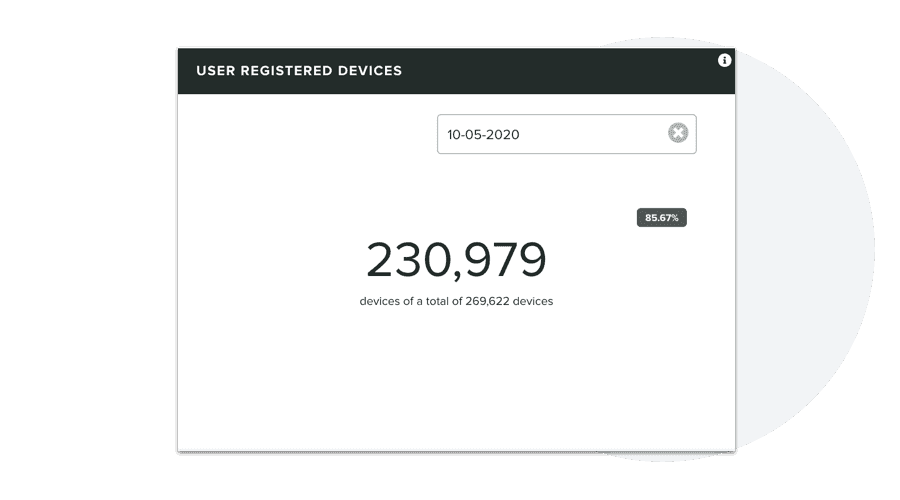
Messaging Enabled Devices
This graph delivers you the total number of devices eligible for remote notifications, email, or SMS. The metric is collected whenever users accept app or web push, opt-in for email or SMS, or eventually opt-out.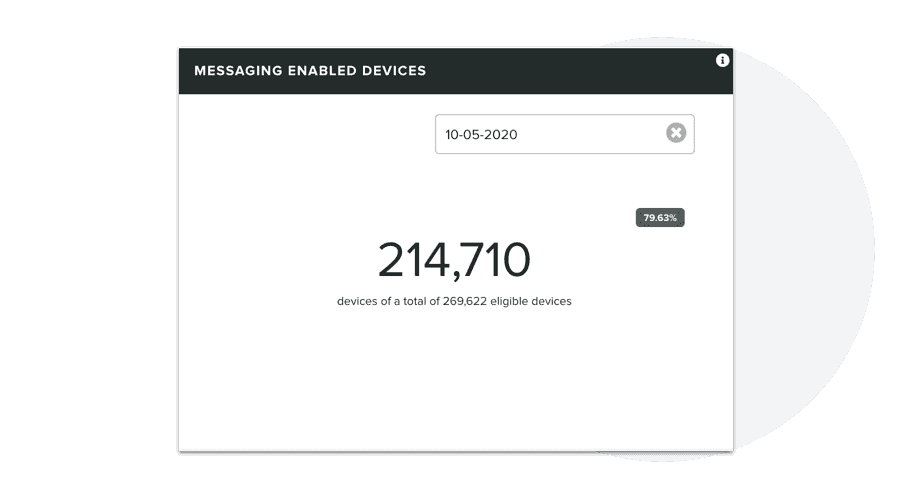
These metrics already supply you essential insights into how your users use the different communication channels that we offer and how you can grow over time by setting targets on the ratios.
User activity
Now that we know the difference between devices and users, and you know how big your entire userbase is, you probably also want to know how active this userbase is. Do they regularly user your app or the website or do they interact with your email messages? This can be found in the User Activity graph. Here you can see how many users were active in the past month, between 1 and 3 months, between 3 and 6 months and older than 6 months.
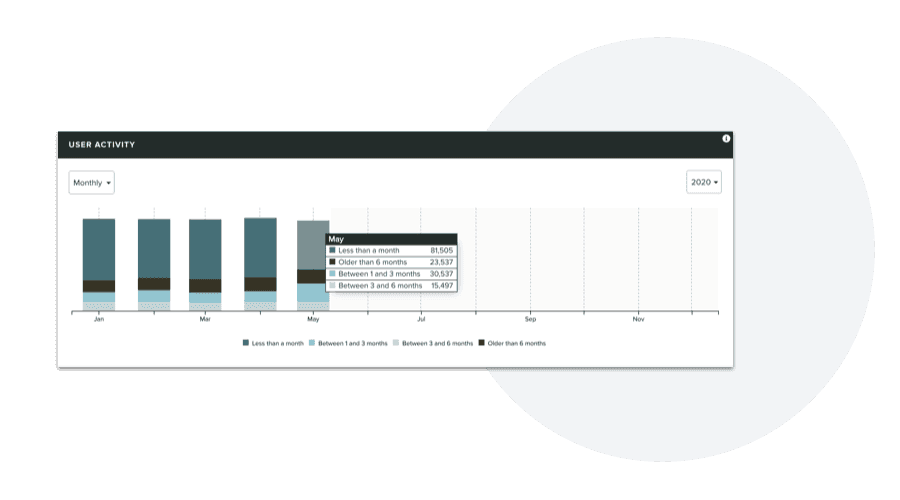
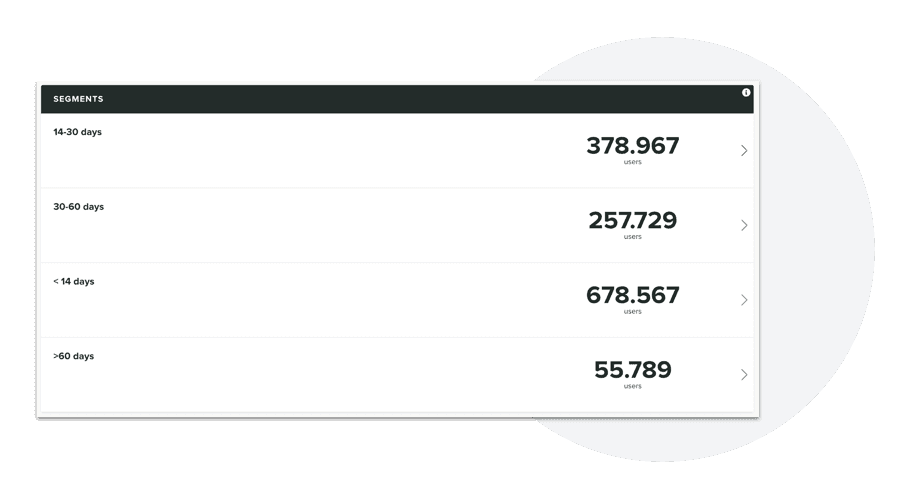
If you want to see a different classification, then you can use segmentation rules in automation connectors to create your own specific cohort. For example, you could create a connector if someone has opened the app and add the following rules:
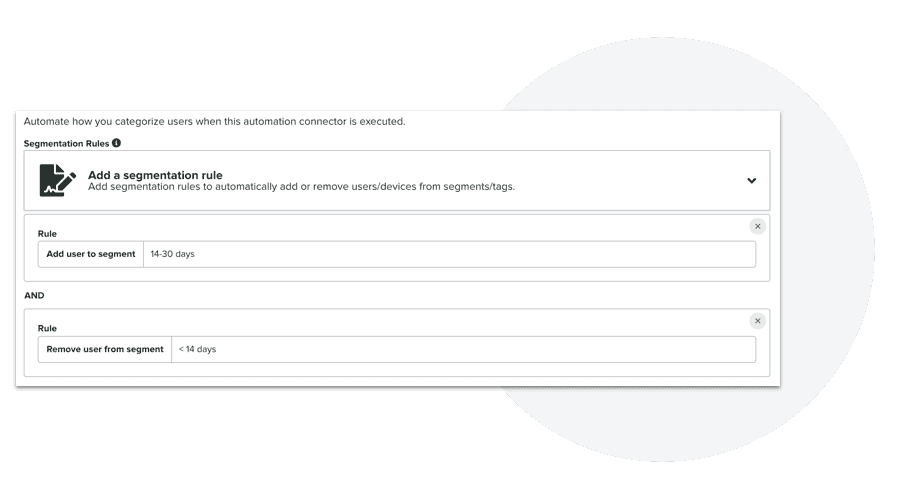
Once you've automated how you categorize users based on their activity, you can then use these segments to streamline your campaigns accordingly.
Want higher ratios?
Do you have questions about how to set up a messaging strategy to optimize your ratios, please contact our Professional Services Team. If you want to get more insights from your app, email, or website through the use of advanced analytics, our engineers can assist you with our Technical Support.


