Using Unified Logging in iOS or tvOS apps

Better debugging and problem diagnosis for your apps

Being able to record a sequence of events that occurred in your apps along with additional data is essential when debugging problems in your apps. This becomes even more important when you are not able to attach a debugger to your app, for example, when you want to debug certain events in a production build or you want to diagnose problems that occurred in the past.
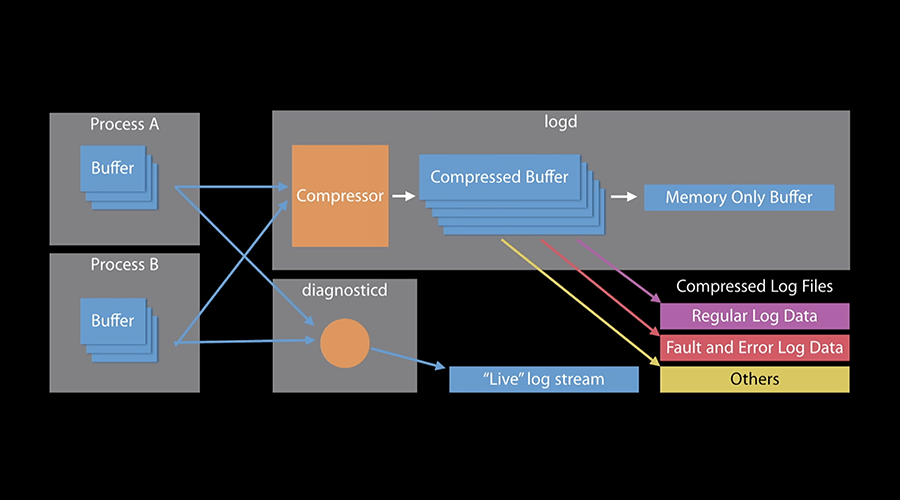
Apple introduced Unified Logging in iOS and tvOS 10 to replace ASL (Apple System Logger) and Syslog APIs. In contrast with these old logging systems, Unified Logging stores messages in memory and in data store, rather than writing them to text-based files.
Of course, there are many frameworks and services out there that can take care of this for you, but in this post we would like to give a short and minimal introduction to Unified Logging and how you can make use of it to quickly debug your apps in macOS's Console app.
Key Concepts
With Unified Logging, you will define subsystems to organize large topics areas and you define categories to distinguish between different types of messages. It's pretty common to create one subsystem for parts of your own code and another subsystem for 3rd party code. Pretty much the same way, you will want to have a category for messages in model code, network events and user-interface functionality.
To record this data, you use different log levels, depending on the level you choose, the Unified system will persist data to store or use memory buffers.
Default
Use this level to store information that might result in failures. They are saved in memory and compress to data store when memory buffers are full.
Info
Use this level for helpful but non-essential messages. They are save in memory and purged when buffers are full.
Debug
Use this level for messages while developing. The system only captures them when debug mode is enabled.
Error
Use this level to capture errors that occur locally on a process level and are recoverable. The system stores these in data store.
Fault
Use this level only when you want to capture information about system-level or multi-process errors. The system stores these in data store.
Additionally, you might want to use activity and signpost for messaging logging. Activity messages allow you to wrap log messages in topics allowing you to correlate events for larger tasks. Signpost messages allow you to use tools like Instruments to visualise critical one-time events, like processing data, while collecting start and end time. We will not cover these in this post.
Getting Started
Unified Logging is available by importing the following header:
#import <os/log.h>You will then want to define your different subsystems and categories. The most flexible way to achieve this is by creating your own. One way to go about this is by having one subsystem for all the events in your app and a category for each type of message you want to log. For example:
static uiLog = os_log_create("com.example.logging", "uiMessages");
static modelLog = os_log_create("com.example.logging", "modelmessages");
Logging Messages
Once you've created your subsystems and categories you can then log your messages as follows:
Info Level
os_log_info(uiLog, "Clicked the signup button");Error Level
os_log_error(modelLog, "Error while creating user");Formatting Messages
To format messages you should use standard NSString and specifiers. For your reference, please see the list of String Format Specifiers.
For example you can use the following:
os_log_info(uiLog, "Clicked button with name: %@", buttonName);To protect the privacy of your users, try to use strings and numbers as much as you can. The Unified Logging system treats dynamic strings and objects to be private and does not automatically collect them. Whenever you need to capture dynamic data, make sure you are not compromising your user's privacy. Then specifically mark those by using the the public keyword as shown below:
os_log_info(uiLog, "Some ID: %{public}s", someID);Using the Console.app
Now that you've logged all the useful telemetry data you care about, you can use the Console app, installed in your macOS, to debug all this data. From spotlight type Console or from Finder go to Applications > Utilities and open the Console app. Then make sure you have the device you want to debug connected to your machine with a cable and click on it to debug:

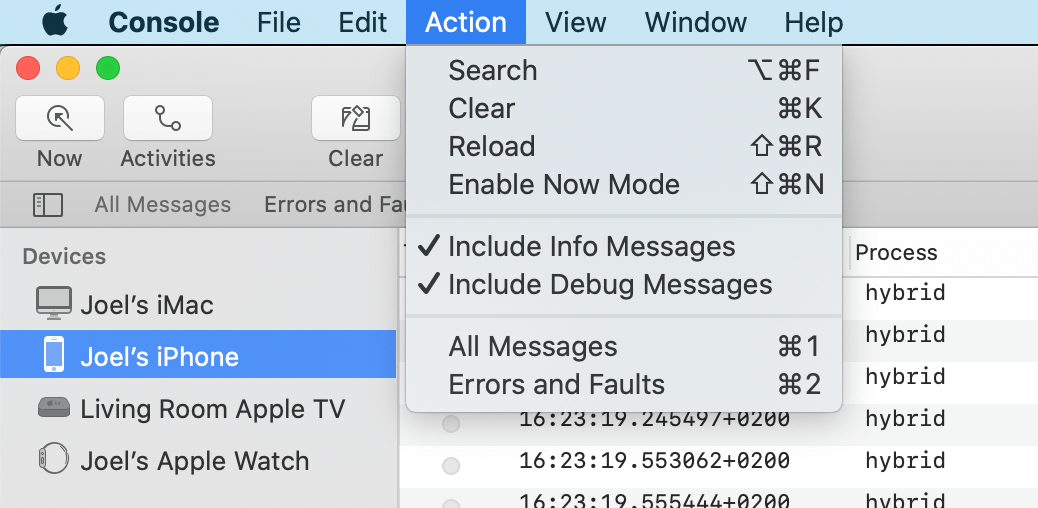
Additionally, make sure you've selected at least the Include Info Messages from the Console's Action option:

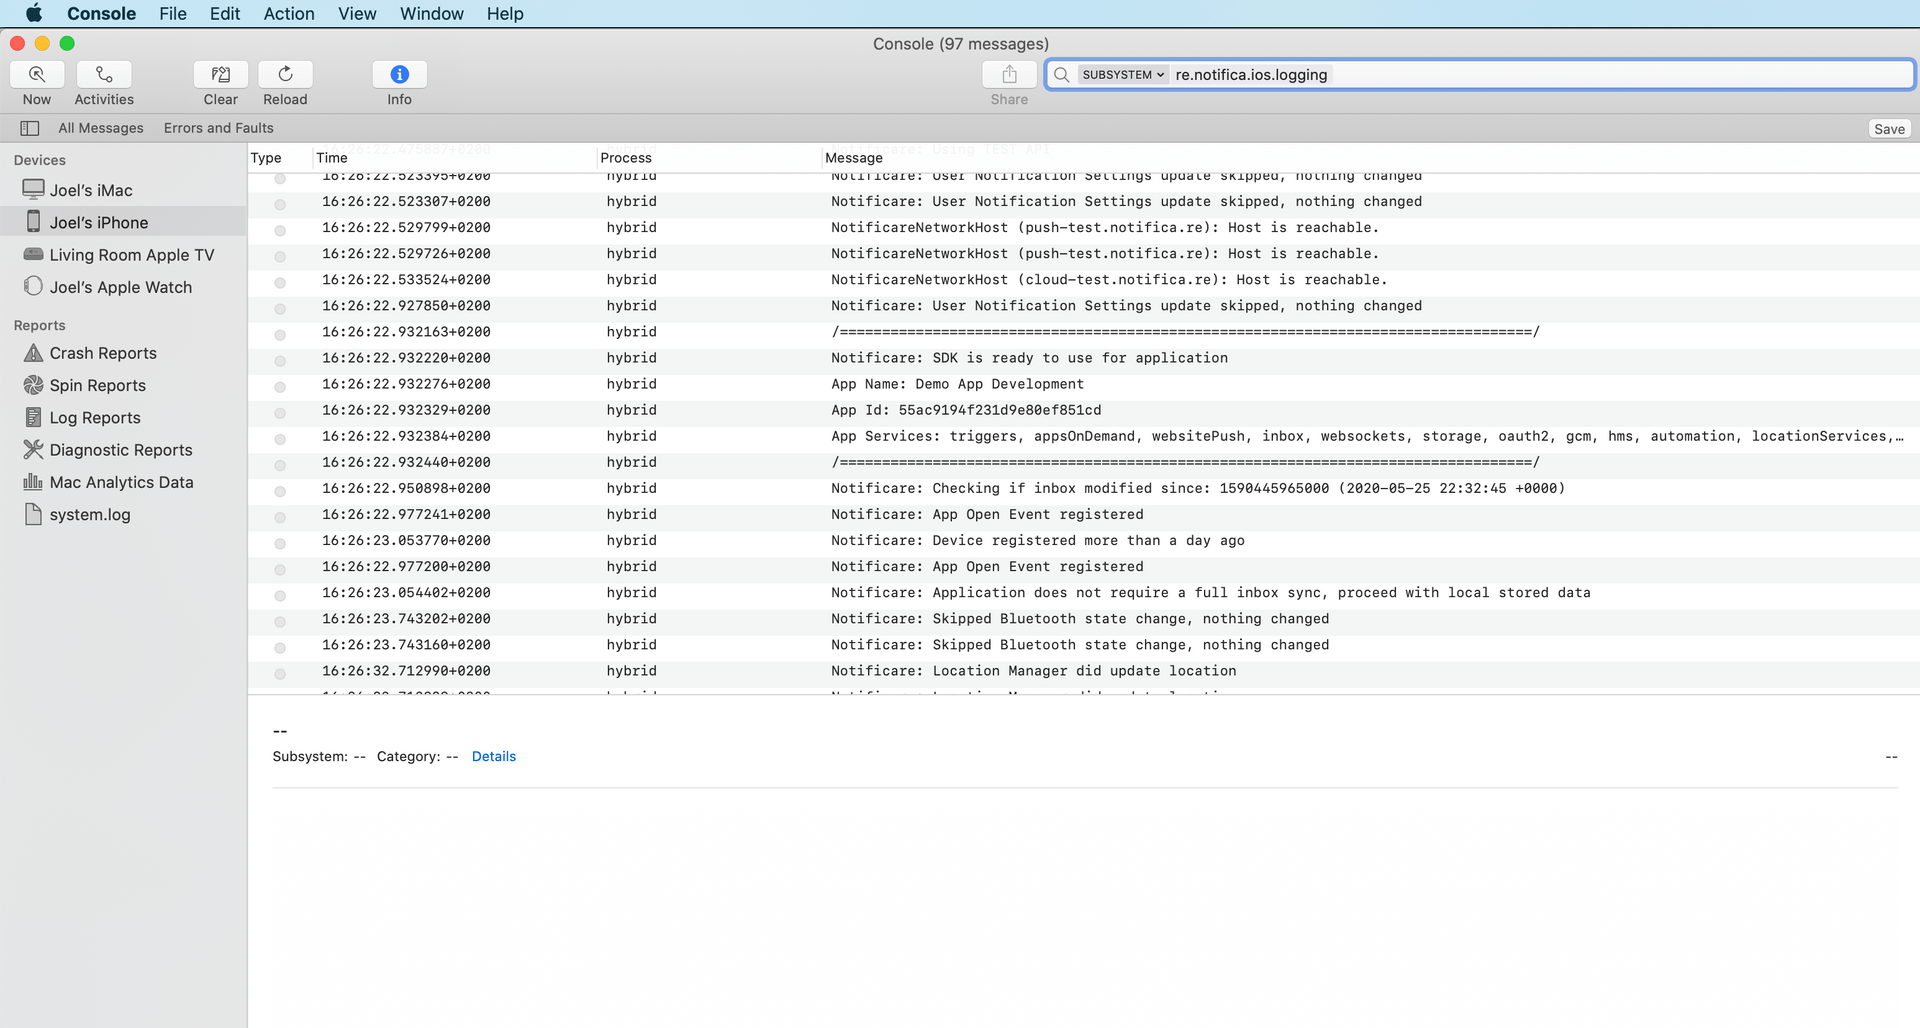
Then to have a fine-grained list of events you've logged, simply use the search field to filter all your subsystem events:

This will allow you to diagnose your code and find potential problems while running tests in a build that you cannot attach a debugger.
Cool, Right?
We hope this is useful information and that you can try for yourself in your own apps. As always we remain available for any question via our Support Channel.
