Monitoring performance with Elastic APM

Using Elastic to monitor performance and errors of your Node.js API.

When maintaining an API it's important to keep track of its performance. From the duration and frequency of requests to the duration of your database queries, we should be able to analyse and act upon that information.
For this, we'll be using a couple of tools from the folks at Elastic:
APM Node.js Agent
Queues, batches and sends performance metrics as well as application errors to the APM Server for processing. This tool supports the most popular frameworks and routers out there.
APM Server
Web server that receives the data from the agents and transforms them into Elasticsearch documents.
Elasticsearch
Simply put, a database for storing and indexing documents.
Kibana
A powerful visualisation tool to explore the documents / APM data in Elasticsearch.
Setting up the APM Agent
First and foremost we need to install the elastic-apm-node package, by running the following command:
npm install elastic-apm-node --saveIn this example we'll be integrating with Express. All we need to do now is configure a couple of parameters and make sure we require the APM module before anything else:
// Add this to the VERY top of the first file loaded in your app
const apm = require('elastic-apm-node').start({
  // Override service name from package.json
  // Allowed characters: a-z, A-Z, 0-9, -, _, and space
  serviceName: '',

  // Use if APM Server requires a token
  secretToken: '',

  // Use if APM Server uses API keys for authentication
  apiKey: '',

  // Set custom APM Server URL (default: http://localhost:8200)
  serverUrl: '',
})
The agent will monitor the whole Express application and any uncaught exceptions.
Monitor every request
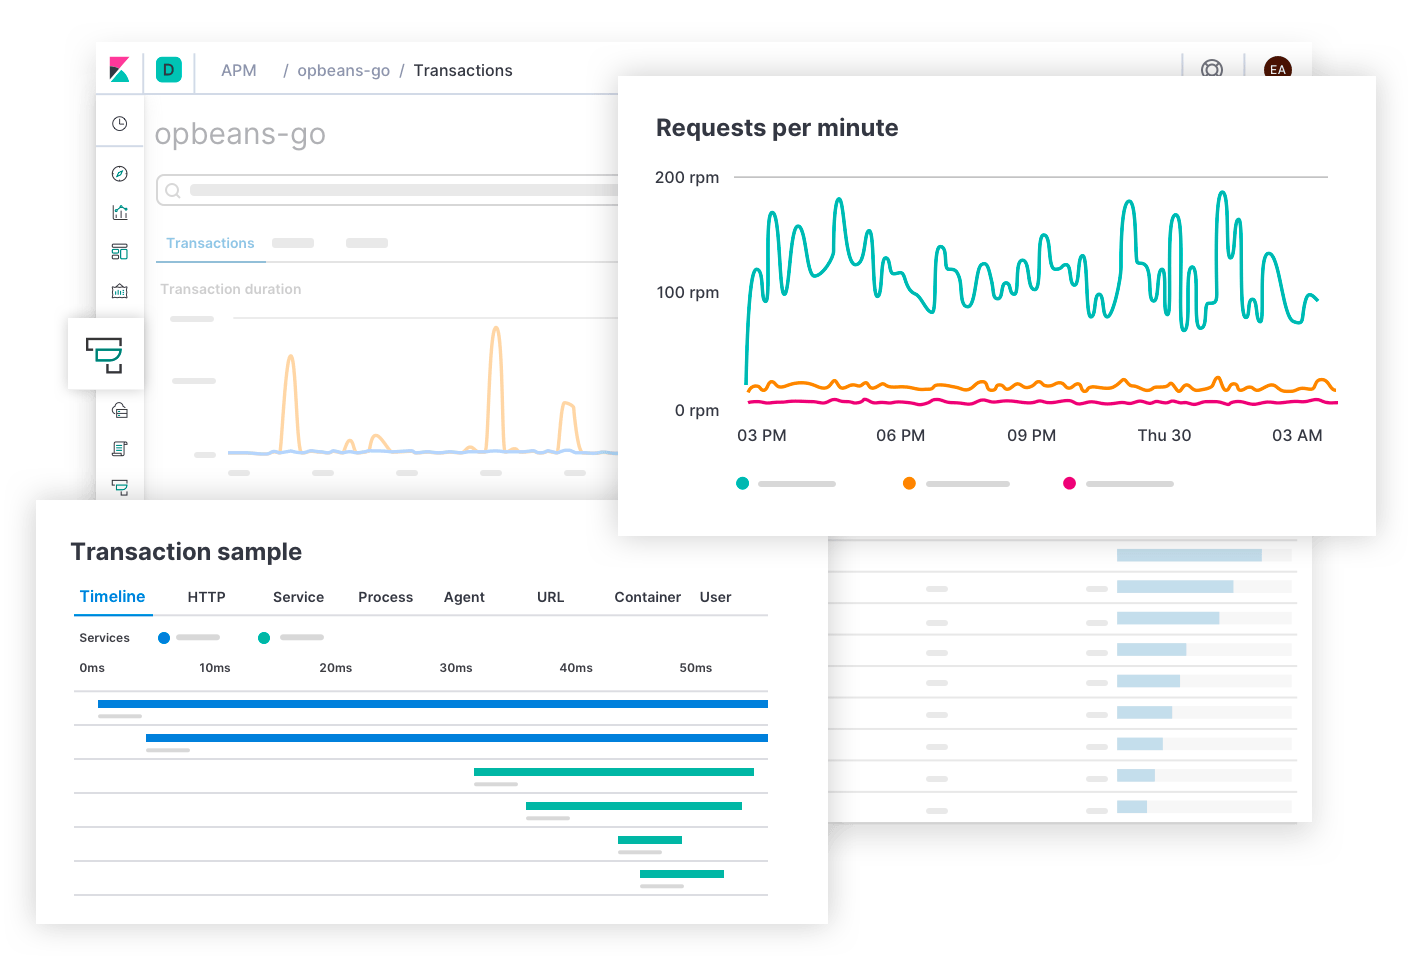
By using the Elastic APM, we can monitor and measure the performance of every request and database transaction.
We can use this information to identify which endpoints are used the most, which transactions are taking too much time to complete and therefore granting us a way to detect problems and improving the performance of our systems.
Code-level profiling
Sometimes we're suspicious about the performance of a particular method in our service. The Elastic APM Agent also allows us to keep track of this.
// start a span to measure the time it takes to run a method
var span = apm.startSpan('generate-jwt');

// execute the method
generateJwt();

// stop the custom span after running the method
span.end();
We can use custom spans to have a fine-grained chart when analysing the performance of a given request.
Application errors
Since the Elastic APM Agent also tracks uncaught exceptions, we can monitor those as well. Additionally, we can capture our handled exceptions:
const error = new Error('Something went wrong.');
apm.captureError(error);
One step forward
By using Kibana, we can create custom alerts for spikes in requests, their latency and increased error rates. Instead of continuously manually monitoring we can be notified to arising problems.

Final thoughts
The whole process couldn't be any simpler and it gives us plenty of insights about the health/performance of our systems. If you want to know more, you can always check out their documentation.
As always, we hope you liked this article and if you have anything to add, we are available via our Support Channel.
